Subscribe to Our Newsletter
Hear more from Equity Methods: Your trusted partner in equity compensation excellence.
Consider, for a moment, your run-of-the-mill TSR award payout structure:

Judging from the above schedule, the payout opportunity has an equivalent upside and downside. It offers 100% extra if you outperform, and 100% lost if you underperform. It looks like a perfect balance.
So if the stock price is $15, and since we have an equal payout opportunity up and down, the accounting fair value should be $15. Right?
Wrong. The fair value is usually much higher than the face value of the stock, often by more than 30% depending on the circumstances.
This apparent puzzle is easily one of the biggest sources of frustration for executives receiving and designing TSR-based awards. It’s a deep in-the-weeds characteristic of TSR awards, but contributes to fewer units being granted for a given aggregate target value of compensation. Too often, we see companies set expectations of award cost based on the face value of the stock, only to be surprised when the fair value turns out to be different…and different in the wrong direction.
Not only are most TSR awards susceptible to this “upward bias,” but also, TSR awards are designed to take advantage of this bias in the ultimate payout. It’s easy to forget that the driver of fair value is the potential payout—what causes a high fair value also creates a powerful upside incentive for strong relative stock returns.
Take a look at the scenarios below, assuming a starting stock price of $15:

Average payout = ($0 + $15 +$40) / 3 = $18.33
As you can see, when we have equally distributed stock price scenarios and equally distributed payout percentages, we still get an average payout that is greater than the starting stock price.
Our downside is always, no matter what, limited to a value of zero—it can’t go negative. However, as the stock price starts increasing, not only does the award benefit from uncapped potential stock prices, the number of shares often multiplies in tandem. This is the “double leverage” effect, and it’s a key driver of TSR award values.
It’s important to understand the extent of double leverage and ways to capitalize on, or mitigate, its effects. The reason is companies often grant units based on the accounting value, whereby they set a target aggregate compensation and divide this number by the accounting value.
Insofar as the accounting value exceeds expectations, fewer units are granted. Companies that base the number of units off the face value of the stock risk disclosing a much higher compensation level in the proxy Summary Compensation Table than they expect.
Given this, here are a couple of ways in which our clients react to the problem of double leverage.
Double down. In some high growth potential firms and turnaround cases, we are starting to see maximum payout levels exceeding even 200%. In these situations, management and the compensation committee thoroughly socialize the notion of double leverage and its somewhat counterintuitive impact on the accounting value. Then they structure an award that sets the performance bar high and offers a lucrative upside if the executives can deliver.
Rein in. Since the double leverage effect results in higher fair values, some award designs cap the overall dollar return (payout percentage x stock price) that can be delivered to the recipient. For example, the payout may be capped at 400% of the original stock price. If your stock price goes up by 300% or 400% on its own, the number of shares paid out would be less than the 200% that would have otherwise been earned. For companies that find such stock price increases unrealistic, value caps can be beneficial. They limit the fair value impact of double leverage in unlikely stock price scenarios, while avoiding a “take” in the eyes of the recipient.
There are countless other ways to work with an award design to rein in the accounting value.
While the intuition of the double leverage effect of TSR awards is reasonably digestible, getting a precise estimate of how much this effect is driving your fair values requires specialized modeling by a professional.
There’s no universal way to help stakeholders accept the concept. But many find comfort in understanding the underlying mathematics. One way to accomplish that is to explain how Monte Carlo simulation estimates the fair value, since that’s what the accounting rules require.
A Monte Carlo simulation involves running up to one million different iterations of how the issuing company’s stock price (and the stock prices of all the comparison group firms) may perform over the performance period. On each iteration, the payout is calculated, and then the combined series of payouts are averaged across iterations to arrive at the fair value.
To illustrate double leverage, imagine an extremely simple Monte Carlo simulation with only 10 different iterations (this blog post would be a little long if we listed all one million iterations):
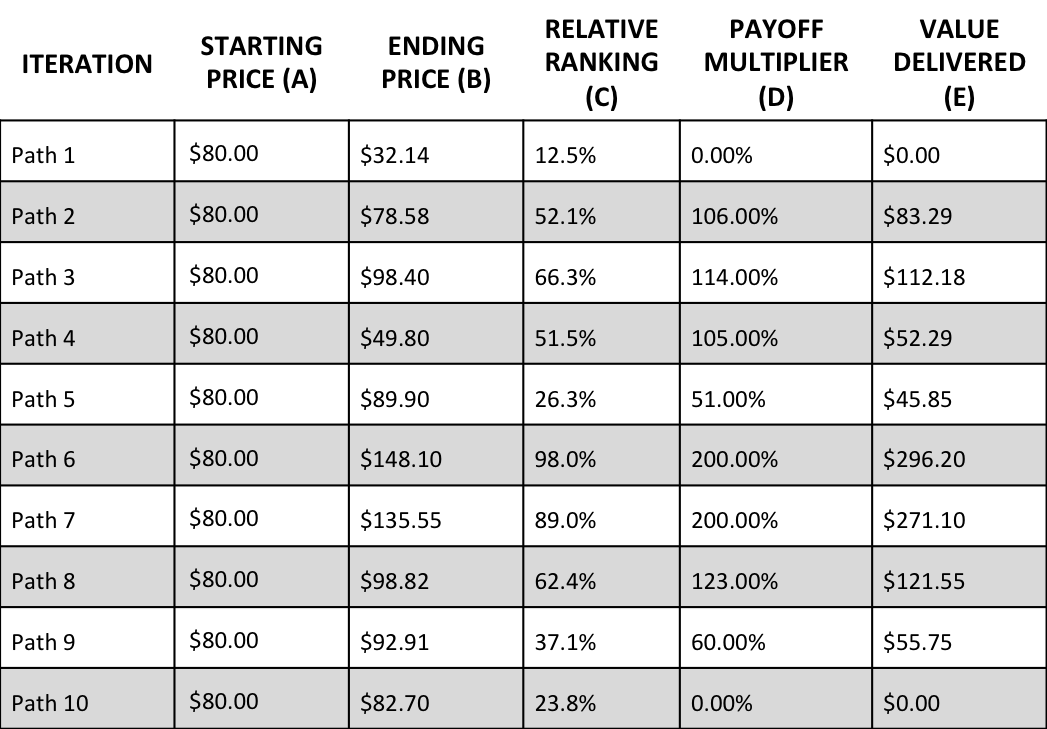
For each iteration (also called a “path”), the stock prices of both the issuing company and the comparison group firms are simulated over the three-year performance period. The ending price of the issuing firm is shown in (B) and the issuing firm’s relative ranking is shown in (C). Naturally, there will be some correlation between these two outcomes, though it is possible for the issuing firm to have a low (high) ending price and still a high (low) relative ranking. Each relative ranking corresponds to a particular payout multiplier in (D), and the product of (D) and (B) yields the value delivered in (E).
When we average the values in (E) across the 10 paths, we arrive at $103.82, which is a 29.8% premium over the face value of the stock. What is driving this? In short, paths six and seven are driving the premium. In both cases, not only is the stock much more valuable, but this more valuable stock is also being multiplied by the 200% payout multiplier. Path one pulls down the average, but its effect is capped, since the payout cannot be negative (whereas the upside is unbounded).
In reality, this kind of simulation would never be run with so few iterations. But a simple example is enough to show why the fair value on a relative TSR award will generally exceed the face value of the stock.
If there’s a way to sum up these ideas, it’s this: Had you asked in 1999 if Apple’s stock price could ever really be $600.00, we would have said, “Maybe.” If you asked whether its stock price would ever be less than $0.00, we would have confidently told you that outcome was just not possible.
David Outlaw is a director of Valuation and HR Advisory Services at Equity Methods. Questions? Contact David to discuss your company’s situation. We are always pleased to be of service.
Was this post helpful? Join our mailing list to receive alerts of future articles!
![]()
